
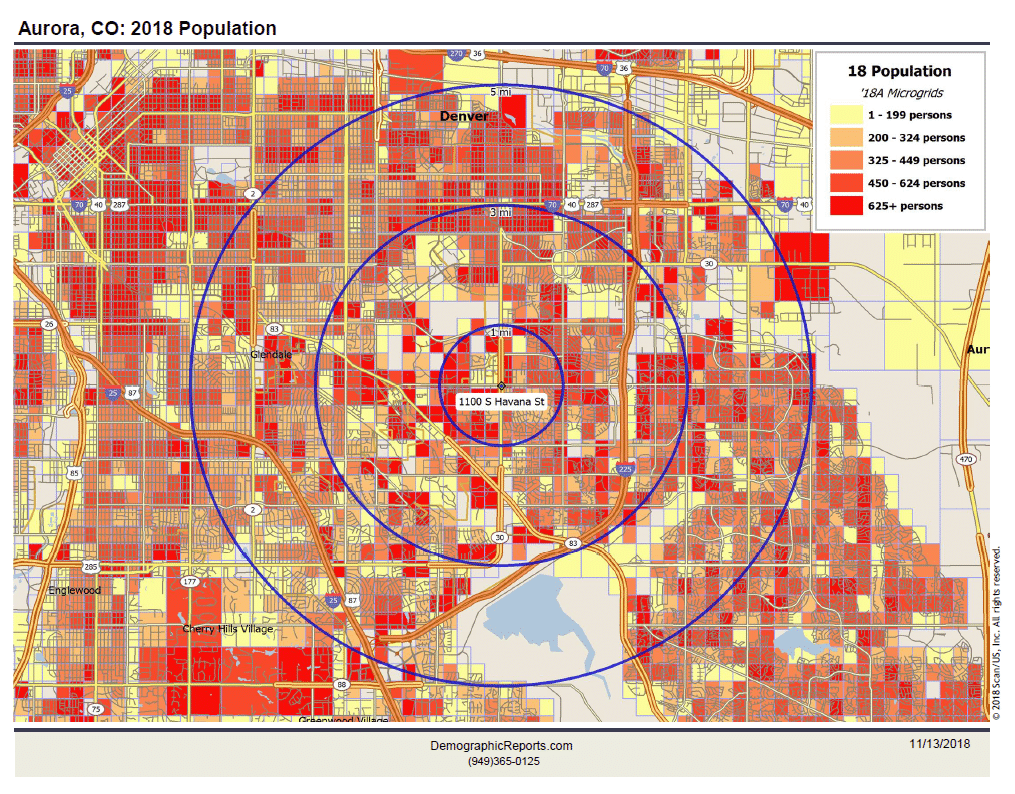
The Havana Business Improvement District, d.b.a. On Havana Street, paid to have Demographic Comparison Reports through DemographicReports.com run in November 2015, 2017 and 2018 to track our progress and provide business owners, neighbors and investors a detailed snapshot of the area. We requested data in three rings around the intersection of Mississippi & Havana (1100 S Havana) which is the center of the Havana District. The rings were 1-mile radius, 3-mile radius and 5-mile radius around 1100 S Havana.
Here are the links to the full demographic reports from both years which include maps, population, income, employment and spending data for the area.
November 2015 Havana BID Demographics Report
November 2017 Havana BID Demographic Report
November 2018 Havana BID Demographics Report
Brief Summary: We compared a few of the report categories, calculating the percent of change, positive or negative.
From the data, we see that today, in November 2018, the population decreased slightly for ages 20-54, ages 55-74 saw an increase in population and overall population increase in diversity.
Income Data 2018 vs. 2017: The Total Aggregate Income of the area is up an average of 26.8% in 2017 over 2015, when averaging the three rings of the study. Then the Total Aggregate Income of the area is up an average of 4.78% in 2018 over 2017.
The average family income is up 10.17% in a 1-mile radius around Havana. The average home value in a 1-mile radius around Havana saw a 22.75% increase in value.
| HAVANA BID DEMOGRAPHICS | 2015 | 2017 | 2018 | CHANGE | % +/- 2018/2017 Comparison |
| TOTAL AGGREGATE INCOME (IN MILLIONS) | |||||
| 1 MILE RING | $669.40 | $832.60 | $872.40 | $39.80 | 4.78% |
| 3 MILE RING | $4,799.30 | $6,088.50 | $6,327.80 | $239.30 | 3.93% |
| 5 MILE RING | $13,883.50 | $17,937.40 | $18,780.10 | $842.70 | 4.70% |
| PER CAPITA INCOME | |||||
| 1 MILE RING | $22,873 | $28,132 | $29,992 | $1,860 | 6.61% |
| 3 MILE RING | $24,234 | $30,744 | $31,798 | $1,054 | 3.43% |
| 5 MILE RING | $29,343 | $37,351 | $39,000 | $1,649 | 4.41% |
| MEDIAN FAMILY INCOME | |||||
| 1 MILE RING | $47,219 | $57,983 | $61,465 | $3,482 | 6.01% |
| 3 MILE RING | $55,673 | $65,852 | $68,608 | $2,756 | 4.19% |
| 5 MILE RING | $70,062 | $81,605 | $85,227 | $3,622 | 4.44% |
| AVERAGE FAMILY INCOME | 2015 | 2017 | 2018 | Change | % +/- |
| 1 MILE RING | $55,813 | $69,133 | $76,163 | $7,030 | 10.17% |
| 3 MILE RING | $65,942 | $84,326 | $88,944 | $4,618 | 5.48% |
| 5 MILE RING | $84,537 | $109,060 | $116,281 | $7,221 | 6.62% |
| TOTAL POPULATION | |||||
| 1 MILE RING | 29,264 | 29,596 | 29,087 | -509 | -1.72% |
| 3 MILE RING | 198,044 | 198,039 | 199,001 | 962 | 0.49% |
| 5 MILE RING | 473,144 | 480,242 | 481,540 | 1,298 | 0.27% |
| MILLENNIALS (AGES 20-34) | |||||
| 1 MILE RING | 7,371 | 7,610 | 7,225 | -385 | -5.06% |
| 3 MILE RING | 48,074 | 48,445 | 48,807 | 362 | 0.75% |
| 5 MILE RING | 112,532 | 116,441 | 116,572 | 131 | 0.11% |
| GEN X (AGES 35-54) | |||||
| 1 MILE RING | 7,299 | 7,291 | 7,107 | -184 | -2.52% |
| 3 MILE RING | 51,046 | 50,650 | 50,961 | 311 | 0.61% |
| 5 MILE RING | 127,771 | 129,618 | 129,887 | 269 | 0.21% |
| BOOMERS (AGES 55-74) | |||||
| 1 MILE RING | 5,678 | 5,734 | 6,072 | 338 | 5.89% |
| 3 MILE RING | 37,273 | 38,259 | 39,176 | 917 | 2.40% |
| 5 MILE RING | 87,570 | 90,363 | 92,417 | 2,054 | 2.27% |
| AVERAGE HOME VALUE | |||||
| 1 MILE RING | $180,678 | $269,881 | $331,282 | $61,401 | 22.75% |
| 3 MILE RING | $208,500 | $302,527 | $358,132 | $55,605 | 18.38% |
| 5 MILE RING | $284,218 | $348,650 | $413,779 | $65,129 | 18.68% |
Other Useful Reports:
ESRI Havana_BID_Household_Budget_Expenditures
ESRI Havana_BID_Retail_Goods_and_Services_Expenditures
ESRI Havana_BID_Retail_MarketPlace_Profile
These reports were shared with the Havana Business Improvement District by a City of Aurora Socioeconomic Planner.